
این یک نمونه رایتینگ تسک ۱ آیلتس آکادمیک در سطح نمره ی ۸ است. لطفا آن را بررسی کرده و ایرادات آن را بیابید و اگر سوالی دارید در قسمت نظرات بپرسید.
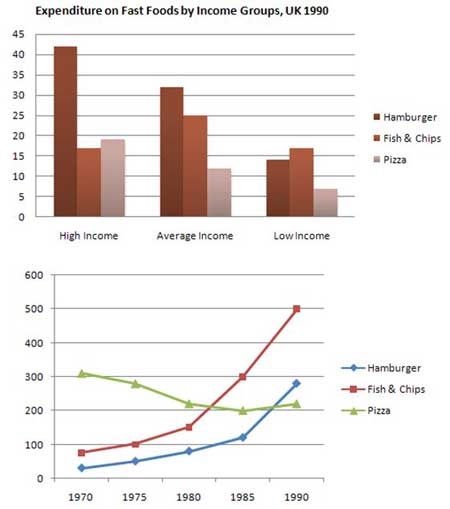
The graph shows the changes in the demand for hamburgers, fish & chips and pizza from 1970 to 1990.
It is immediately apparent that in 1970 the most popular food was pizza. The demand for pizza started from 300 grams followed by a spectacular fall of 200 grams in 1985.
The striking feature of the graph is the demand for fish & chips. In 1970, fish & chips were the second favourite food among people, and from 1980 on the total demand surged to a high of 500 grams from 99 in 1970.
Furthermore, hamburgers were the least popular food in 1970 with the total demand of 15 grams, which increased gradually till 1985. The total demand for hamburgers skyrocketed to 299 grams in 1990.
In conclusion, there was a subsential increase in the demand for hamburgers and sea food, whereas there was a significant fall in the popularity of pizza.
منبع: ielts-blog.com
اگر مطلب مورد نظر را مفید دیدید، لطفا آن را در شبکه های اجتماعی به اشتراک بگذارید.
برای کسب اطلاعات بیشتر در مورد دوره های آموزش زبان به لینک داده شده مراجعه نمایید.


نظرات