این یک نمونه رایتینگ تسک ۱ آیلتس آکادمیک در سطح نمره ی ۸ است. لطفا آن را بررسی کرده و ایرادات آن را بیابید و اگر سوالی دارید در قسمت نظرات بپرسید.
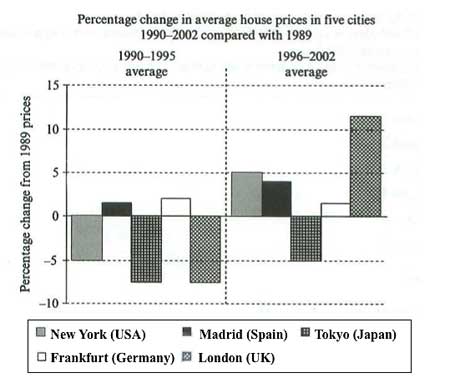
The graph illustrates the figures of average house prices in the five different cities during the period from 1990 to 2002, in comparison with the data in 1989. Overall, there was an upward trend in the percentage of change of house prices during the period shown in almost all of the cities except for Frankfurt.
As can be clearly seen, there was a considerable fall by approximately 5% in the proportion change of estate prices in New York between 1990 and 1995. Likewise, Tokyo and London, which had the same figures, witnessed a dramatic decrease by about 7% over the same period. However, the figures for Madrid and Frankfurt were around 2% and 3%, respectively.
During the latter period from 1996 to 2002, the figure for London was the highest with more than 10% in the percentage of change of house prices. During the same period, the rates at which the house prices increased were about 5% in New York and 4% in Madrid. This rate in Frankfurt was 2%, lower than than in the first 5-year period. Finally, the percentage change in Tokyo fell by around 5% between 1996 and 2002.
منبع: ielts-blog.com
اگر مطلب مورد نظر را مفید دیدید، لطفا آن را در شبکه های اجتماعی به اشتراک بگذارید.
برای کسب اطلاعات بیشتر در مورد دوره های کلاس های خصوصی زبان انگلیسی به لینک داده شده مراجعه نمایید.


نظرات